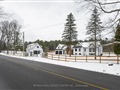
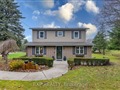
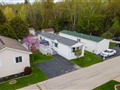
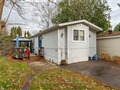
42 Sandy Shores Blvd
$3,937,879
Comparative Market Analysis
Jun 15, 2025
NOT AN ACTIVE LISTING
Historical Performance
| Period | $ Change | % Change |
| 1 Day | +$262 | +0.007% |
| 7 Days | -$2,423 | -0.061% |
| 30 Days | -$14.1k | -0.356% |
| 3 Months | -$20.5k | -0.518% |
| 6 Months | +$59.1k | +1.52% |
| 1 Year | -$215k | -5.18% |
| 3 Years | +$589k | +17.6% |
| 5 Years | +$948k | +31.7% |
| 10 Years | +$1.97m | +99.7% |
List My Property
Real Estate Statistics
Financing Solutions
AS SEEN ON


Are You a Licensed Real Estate Agent or Broker?